An e-bike is quite an investment – you’ll pay at least $2,000; many are $10,000 or more.
You might think many of them look and feel similar on a quick test ride. That’s where our unbiased, independent testing comes in – so you don’t buy one that won’t do what you want it to.
We assess each e-bike’s features and functions, then ride it for more than 125km on roads, shared paths and trails, up and down hills, around town and (where appropriate) on mountain bike trails.
Overall score breakdown
It’s likely you’ll want an electric bike for more than one scenario. Our test shows which e-bikes can handle multiple situations and surfaces, and which excel at just one thing.
We assess each e-bike’s performance and make recommendations for five use types:
Mountain: Grade 3 and 4 mountain bike tracks.
Trail: Easier, off-road trails, including gravel and rail trails plus grade 1 and 2 mountain bike tracks.
Road: Longer distances on sealed surfaces – perfect for commutes.
Daily (urban): Running errands around town and short commutes.
Cargo: Carrying heavy loads – some can transport one or two small children.
We also score each e-bike for Quality. This is an expert view of the e-bike’s overall quality, the parts fitted and the ease of using the e-system controls and display.
How we assess e-bike performance
We assess static and dynamic elements of the bike and its e-system.
Our assessments of the e-bike include its cargo-carrying capacity, the ease of mounting the bike, performance of the suspension for comfort and off-road riding, convenience and weather protection, low-speed balance and steering, high-speed stability and braking, and its ability on rough roads and paths.
For the e-system, we include its response to pedalling effort and its lag when starting or stopping pedalling, the maximum assistance available and the usable assistance in lower settings, its ability to climb hills, the assistance at higher speed, and the riding range available from the battery.
We weight our assessments differently for each use type. For example, the ability to remain balanced and stable while carrying a load and having a powerful motor that responds well to pedalling effort are very important for a cargo e-bike. Meanwhile, a trail e-bike needs suspension and tyres that are comfortable and confident off-road, and an e-system that works well at lower assistance settings, so it has a good riding range.
Riding tests: four routes, 125km
Our experience testing more than 50 e-bikes shows that most are fine if you just want to tootle around the local shops or cruise along flat paths. So we put each bike through much tougher riding tests to sort the best from the average.
We use a power pedal to measure the effort of our test rider, so we can compare the performance of the electric bikes objectively.
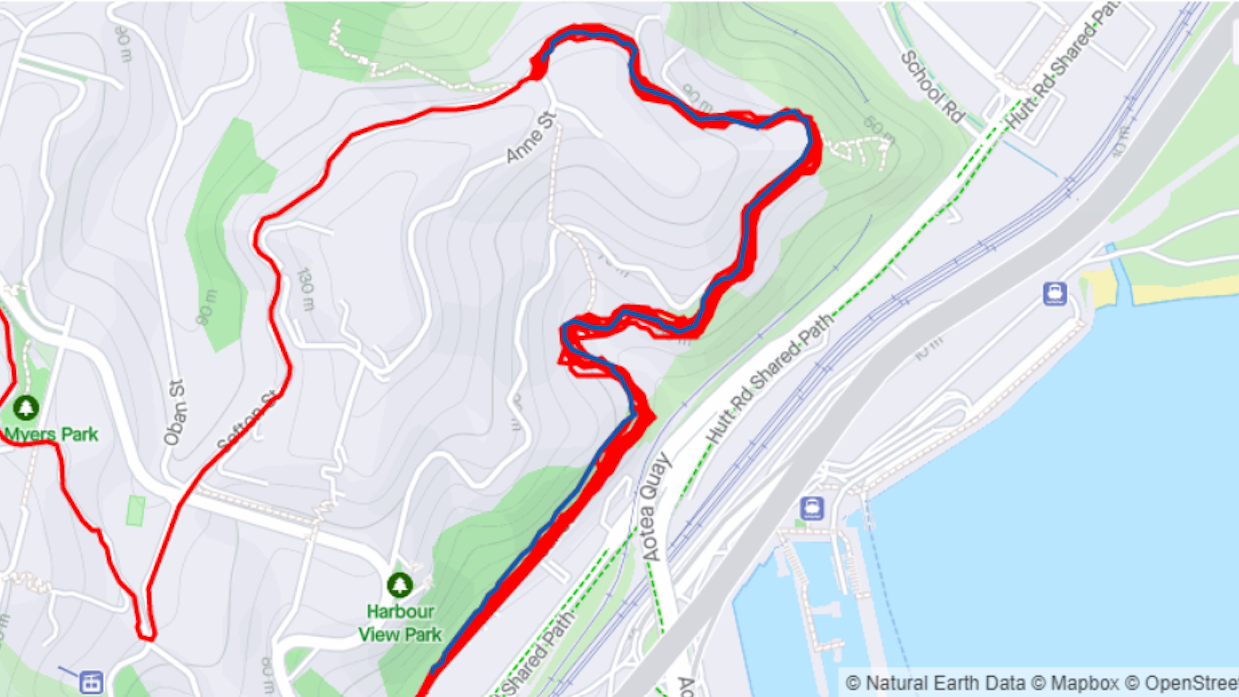
No two test rides are identical, but we follow defined routes, travel at pre-determined speeds and ensure weather conditions are similar for each one to get a fair comparison of the e-bikes. We record GPS and power data for our test rides using the Strava app, so we can accurately analyse and compare the performance of different electric bikes.
Our test routes
Urban
This is a 5km route in and around Wellington’s CBD, including city traffic, fast and flat roads, hills, kerbs, wooden bridges and a busy waterfront path shared with pedestrians.
Suburban hills
This is a gruelling 25km route around Wellington’s western suburbs. The main challenge is a 1.35km-long hill that rises 100m at a gradient between 6% and 11% – a climb repeated five times. We use the maximum assistance setting and maintain a steady 19–20km/h during the climb, then descend the same twisty, narrow road. This route also includes a short 20% gradient grass climb, an undulating 10km of suburban streets and two steep descents requiring good brakes to keep to the 50km/h speed limit.
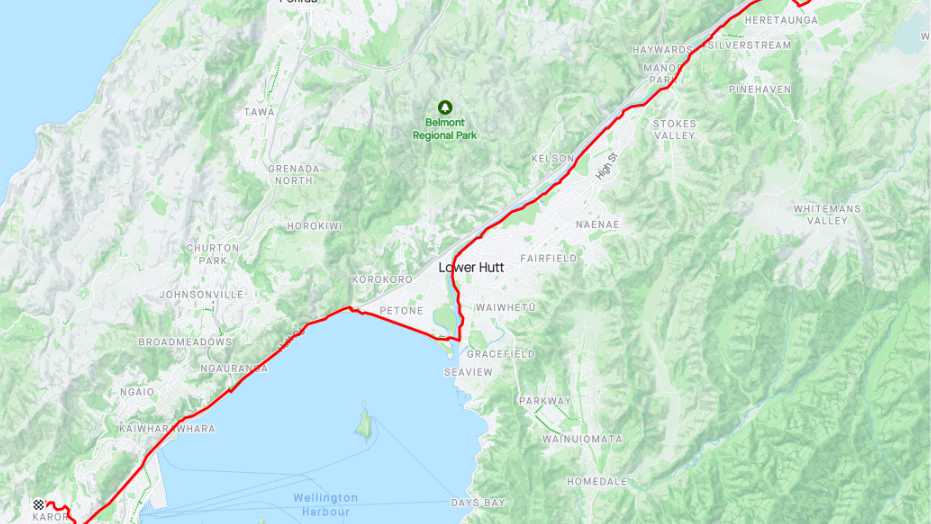
Rail trail
This 80km round trip goes from Wellington to Upper Hutt and back, using the Hutt River cycle trail. We use lower assistance levels – how low depends how much battery we need to eke out to complete the trip. The route covers a mix of surfaces, including grade 1 and 2 trails, sealed paths, roads, and a cycleway alongside State Highway 2. It’s mostly flat, climbing gradually to the turnaround point as the route follows the Hutt River upstream (usually riding into a northerly). It ends with a 5km climb rising 200m – usually when the battery is almost drained.
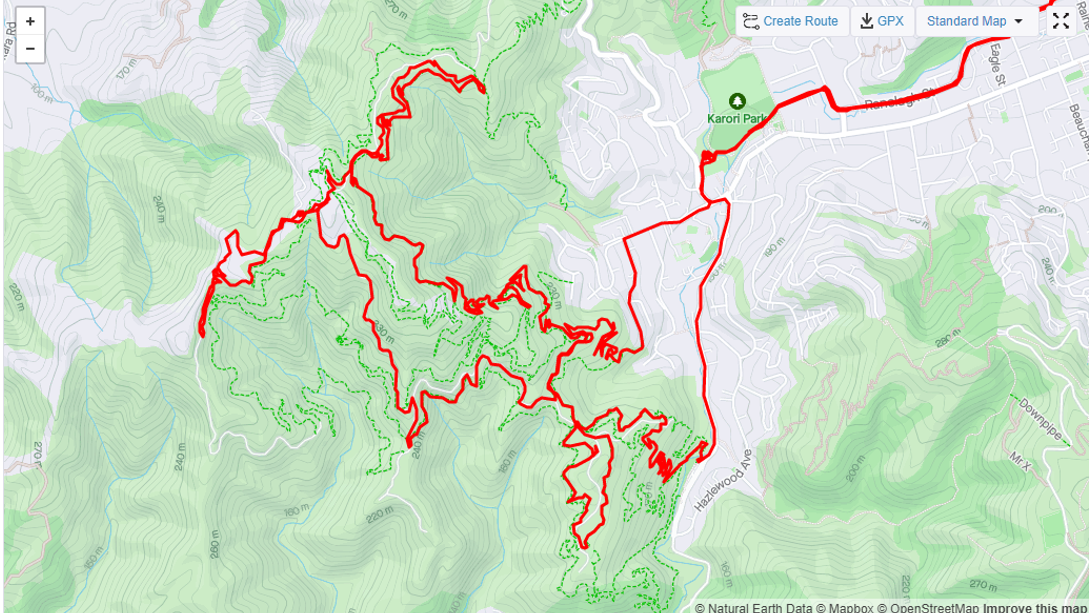
Mountain bike
This is a ride of up to 20km around the Makara Peak mountain bike park in Wellington’s western suburbs. We start on grade 2 trails, then progress through grades 3 and 4 (if the bike can handle them). We only rate bikes in this category if they can confidently cope riding grade 3 tracks. Our test rider is a competent mountain biker, familiar with the Makara Peak trails.
Mountain bike track grading
Easiest (Grade 1): Fairly flat, wide, smooth track or gravel road.
Easy (Grade 2): Mostly flat with some gentle climbs on smooth track with easily avoidable obstacles such as rocks and potholes.
Intermediate (Grade 3): Steep slopes and/or avoidable obstacles possibly on narrow track and/or with poor traction. There may be exposure at the track’s outside edge.
Advanced (Grade 4): A mixture of long, steep climbs, narrow track, poor traction and obstacles that are difficult to avoid or jump over. Generally exposed at the track’s outside edge. Most riders will find some sections easier to walk.
Electric bike reliability and satisfaction
We survey consumers regularly to find out how reliable different brands of electric bikes are (based on the faults reported) and how satisfied people are with e-bikes from different brands. We use this data to produce our predicted reliability and brand satisfaction scores.
We use a statistical test to rate the relative performance of each brand. Compared to data we have for all products (of the same type) in the survey, we rate each brand with highest, high, average, low or lowest for predicted reliability and brand satisfaction respectively.
We analyse brands that get at least 30 responses in our survey. That means there are some brands we can’t analyse because we don’t have enough data. For those brands, we assume they have average reliability and satisfaction.
Our data is based on 1,081 responses from owners of electric bikes in our 2025 survey.